

Swamicharts Indicator
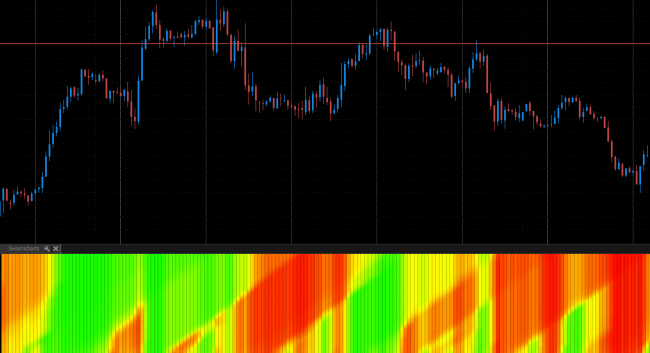
The SwamiCharts is a classic interpretation of stochastics indicator introduced by John Ehlers and Ric Way. A wonder tool, with stuffed visualization effects, demonstrates a method of producing heatmaps from collection of common indicators. A range of stochastic values with different periods is adjusted along with one single bar, by a generating a color gradient for each of them. This way it is easy to determine, whether it is good time to sell (red area),buy (lime-green area) or stay away from trading (yellow shades). Go on, try it on!
Files
 22.09.2017
 3
3
Discussion
Join PTMC community to post your comments
No comments yet. Be the first.

