

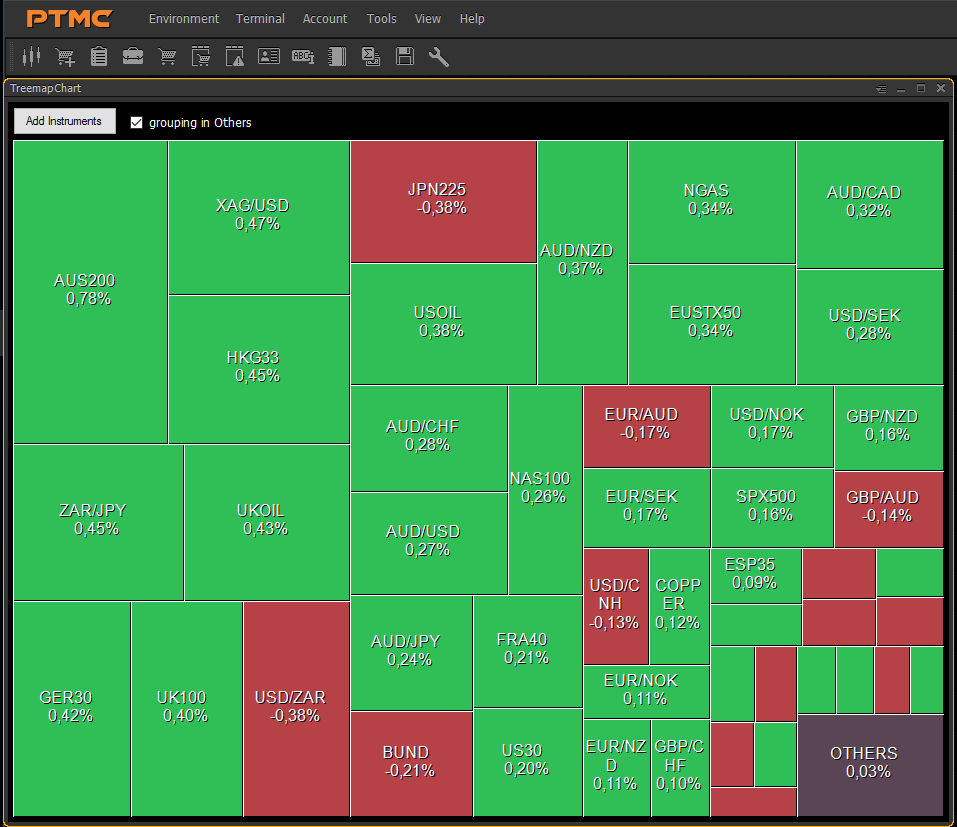
Treemap for displaying Watchlist's value "Change,%"
What is the purpose of treamap? Treemap displays data as a set of nested rectangles. It has a special advantage: an area of each element is proportional to a specified dimension of presented data.
Going further, adding color's condition gives more visible information to react on changes (area, color, transparency) for thousands of displayed items at one moment.
EXAMPLE:
Let's assume, that you have an idea to display some trading data for a set of symbols in treemap manner. In our case we have taken this data from the column “Change,%” of the Watchlist tool. What do we need to do?
It's simple, we take our API to get any kind of information about trading activities and some of implementation of treemap algorithm. By keeping it together, we can reach our goal and even more by adding extra parameters for any enhancement.
As a result, we have a useful graphical tool that can help us to keep an eye on any desired parameter (such as Change per period, Volume difference etc.) of a wide symbols set.
Please use this manual "How to install trade Plug-in to PTMC trading platform"
 05.10.2016
 61
61

