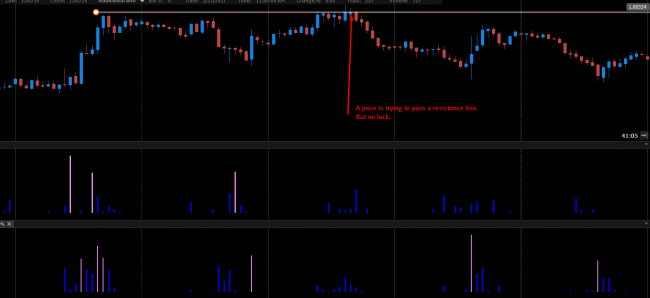
RVI&FoM Indicators
A hot couple of tools is available for PTMC followers. Relative Volume Indicator (RVI) combined with Freedom of Movement Indicator (FoM). A budding synergy developed by Melvin E. Dickover is stating support-resistance levels in the market throughout detection of supply and demand pools. Both are histograms, with custom level to spot large or regular bars. According to author’s paper, default input value is 2.0 on both charts and therefore bars overlapping denotes so called "Defended Price Lines" (DPLs), which trader manually plots to confirm local extremums. Simple and yet consistent tool to perform risk measures.
 21.02.2017
 7
7


