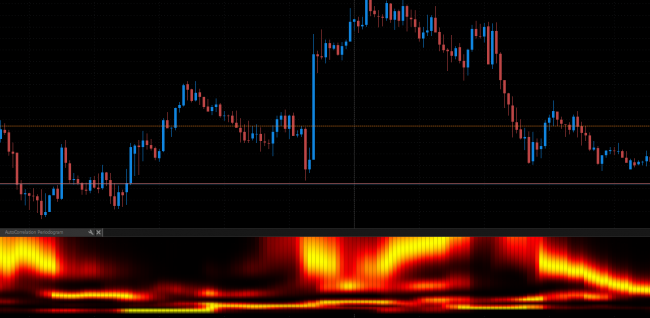
Autocorrelation Periodogram
A great work presented by John Ehlers in “Measuring Market Cycles” article, now available for PTMC users via code. The algorithm uses a digital signal processing to determine a market cycles and their length. The major cycle periods and their absence are presented with a range of colors (from hot yellow as highest amplitude to the cold black as lowest one). With that feature it is possible to adjust periods of traditional indicators as RSI, Stochastic, CCI and etc. Perfect assistant to any strategy, which aims to be profitable.
Files
 07.06.2017
 5
5
Discussion
Join PTMC community to post your comments
No comments yet. Be the first.


